Bert Stoneberg <k12researchidaho@gmail.com> Sat, Nov 16, 2019 at 2:12 PM
To: Karlynn Laraway <klaraway@sde.idaho.gov>, Kelly Everitt <keveritt@sde.idaho.gov>
Cc: Jennifer Swindell <JSwindell@idahoednews.org>
Hi
Just so you don't miss it, today I posted this to the Facebook pages for IdahoEdNews and the State of Idaho Education Discussion Group.
Please take the time to read all six points, especially the sixth.
First, the new IRI reading scores reported are the “percent of students at grade level,” which is a “percent above a cut score” metric. It should be noted that these are the only IRI scores that the State Department of Education publishes on its website.
Second, “numbers drop” suggests a look at trends over time.
Third, “achievement gaps linger” suggests a look at trends in gaps.
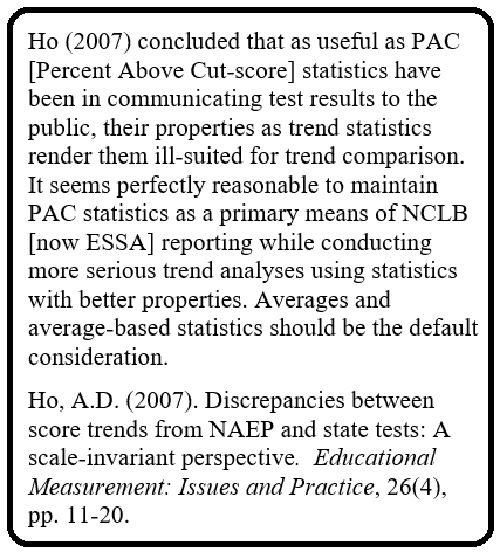
Fourth, Holland (2002) examined misinterpretations associated with using the “percent above a cut score” metric. This metric is widely used [e.g., NAEP, ISAT, IRI, SAT], but there are serious limitations to inferences that it can support, particularly when evaluating trends over time, gaps among groups, or trends in gaps.
Fifth, IRI scale scores should be used when reporting the reading achievement, not IRI percent at grade level scores. The National Academies of Sciences, Engineering and Medicine (2017) reported: One of the most common and unwarranted inferences involves assessing the amount of progress students have made over time. For instance, news reports often focus not only on how students are doing at a particular time, but the extent to which the percentage of students scoring Proficient or above has (or has not) improved over successive assessments. When these comparisons are based on the scale scores, they provide useful information. When they are based on the ’percentage Proficient or above’ metric and used to compare progress across groups, they can be misleading.
Sixth, a personal plea. I recently suggested to the State Department of Education that it publish scale score results (i.e., the number of students with valid test scores, the average/mean score, and the standard deviation) for all of the ISAT tests, grades, and (sub)groups for which they publish the “percent above a cut score” percentages. This suggestion should be extended to publishing IRI results. The department’s response to my suggestion was, “Thank you for your interest.” Until enough educators, parents and members of the public (including news organizations) make this suggestion to the State Department of Education, it will continue to give us only test results burdened with limited utility for understanding and supporting student achievement in Idaho.
Bert
----------------------
Holland, P. (2002). Two measures of change in the gaps between the CDFs of test-score distributions.” Journal of Educational and Behavioral Statistics, 27(1), 3-17.
Learning Point Associates. (2009). Connecting research to practice: Knowing who is proficient isn't always sufficient. Available at http://files.eric.ed.gov/fulltext/ED509965.pdf
National Academies of Sciences, Engineering, and Medicine. (2017). Evaluation of the achievement levels for mathematics and reading on the National Assessment of Educational Progress. Washington, DC: The National Academies Press.